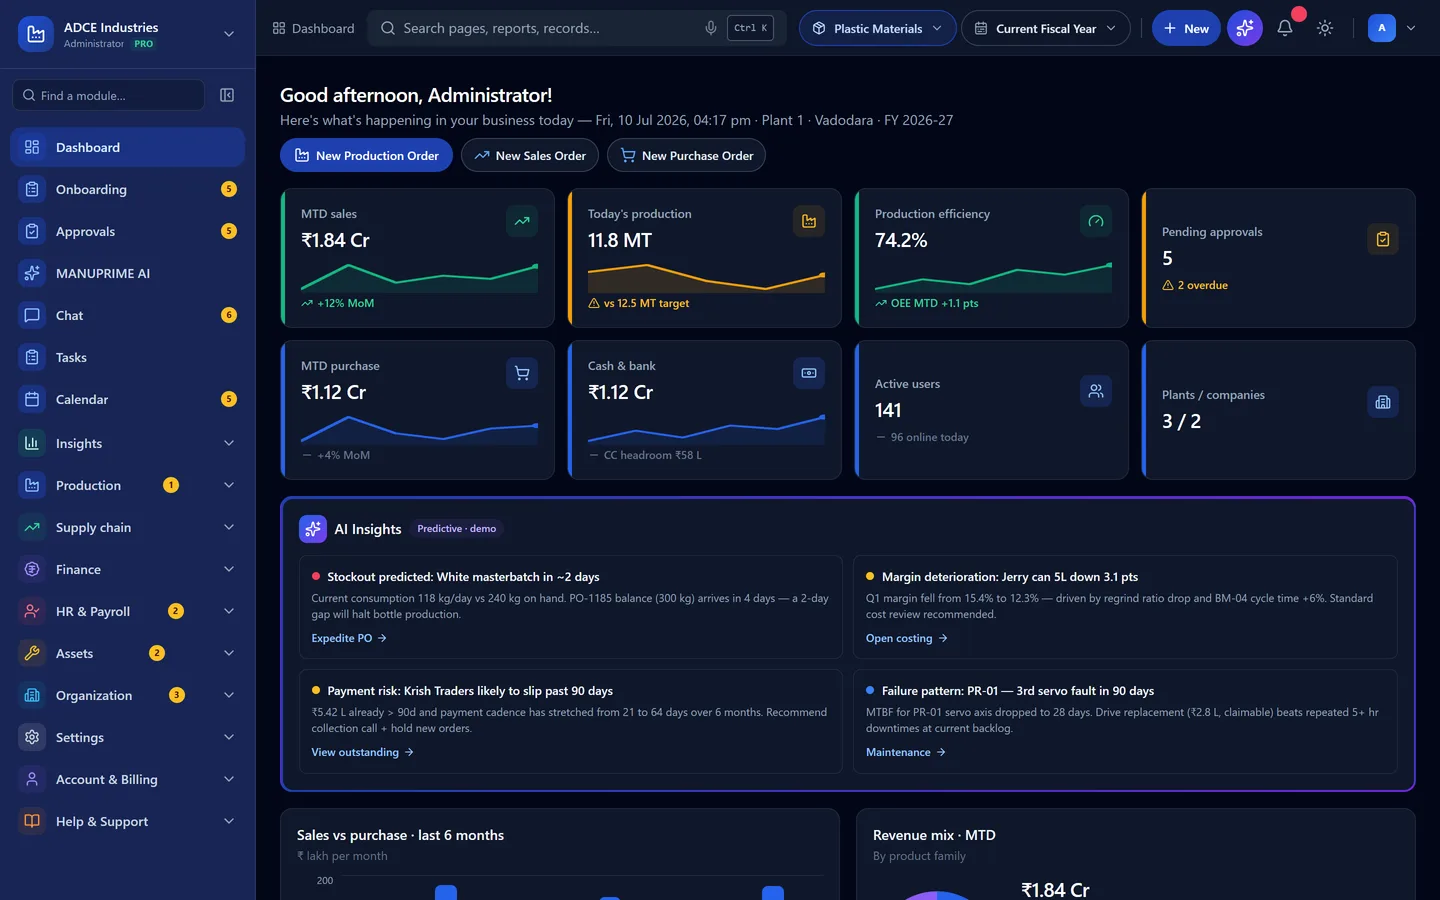
Reading your role dashboard
Each role gets its own KPI set — Administrator, Manager, Supervisor, Production, QC, Accountant, HR and more.
KPI cards show value, trend sparkline and change. Every card is clickable and jumps to the underlying module or report.
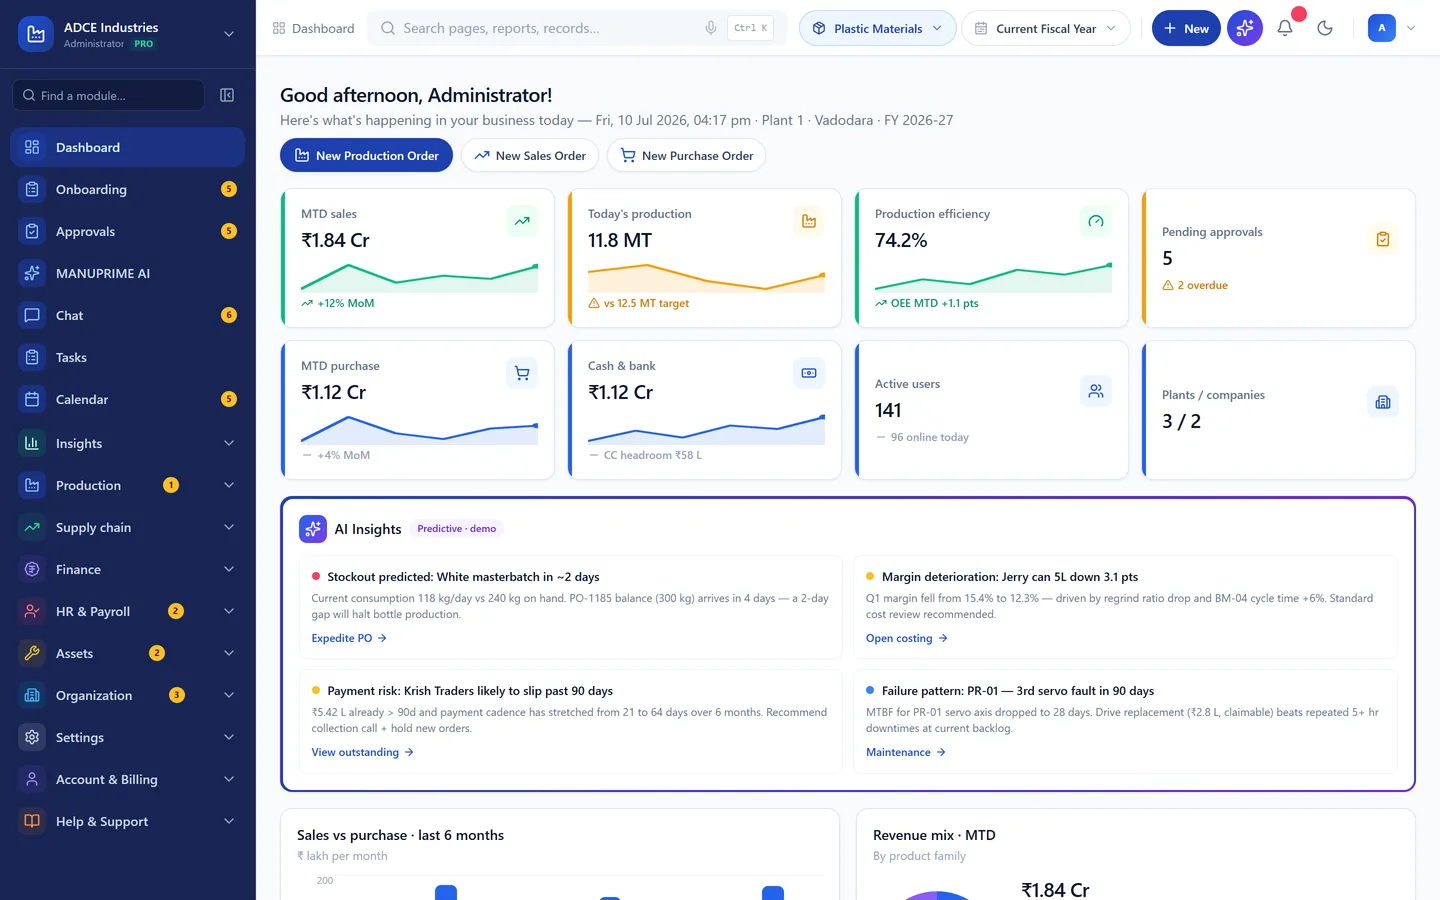
KPIs, AI Insights, charts and approval queue The AI Insights strip predicts stockouts, margin deterioration, payment risk and machine failure patterns — each with a one-click action.
Charts (sales vs purchase, revenue mix donut, shift gauges) update with the selected company/plant and financial year from the header context selector.